This is a Models-Page that will help you
discover (and recognize & improve, and
understand more deeply in many ways)
the process you intuitively use while you
are designing solutions to solve problems.
 learning by discovering: When you explore the diagrams in my model for problem solving, you will discover. You will understand the creative-and-critical Actions that people (you, me, and others) typically use when we are “making things better” by solving problems. These productive Actions are logically organized — so they are easier to understand, and are more effective for helping people (teachers & students, and others) improve their problem-solving skills — in my model for Design Process, i.e. for the Design-Thinking Process that is Problem-Solving Process. learning by discovering: When you explore the diagrams in my model for problem solving, you will discover. You will understand the creative-and-critical Actions that people (you, me, and others) typically use when we are “making things better” by solving problems. These productive Actions are logically organized — so they are easier to understand, and are more effective for helping people (teachers & students, and others) improve their problem-solving skills — in my model for Design Process, i.e. for the Design-Thinking Process that is Problem-Solving Process.
your process of exploring: In each diagram, observe (and think about) the words & colors and spatial relationships, always asking “what does this mean? what action is being described?”
your process of recognizing: While you're exploring diagrams, think about the actions you use (naturally & intuitively) while you are solving problems, and you will recognize that your Problem-Solving Actions in Your Everyday Life are the Problem-Solving Actions in Design Process. In this way your Discovery Learning will become Recognition Learning, when you recognize that Design Process is Your Process.
your process of understanding: I want to help you (and your students) improve your knowledge in many ways, on many levels. This page will help you develop a deep understanding of my model for Design Process (for Problem-Solving Process), as explained in its Table of Contents. But the best way to develop a basic understanding is by using Part 1 of the HomePage. It will guide your “Discovery Learning” to help you learn the Three Essential Actions and other important Actions; it ends with Recognition Learning by encouraging you to ask questions (“Do I often...?”) so you'll understand how-and-why Design Process is Your Process.
a student's process of learning: Let's look at their process and your process. / Although your process of exploring – so you will Discover and Recognize – can be guided by the next major part of this page (made in July 2025), I think "the best process" is a newer section (March 2026) that is Part 1 of the HomePage. Both options lead you through the same overall “discovery process” but with different styles of teaching. / If you are a teacher who enjoys thinking about teaching-and-learning, you'll be motivated to learn more about their process. You can invest a little more time (it won't require much, and will be rewarded) to use three guides — these two plus Slides 23-29 (February 2026) of a PowerPoint — so you can compare the different approaches. Your comparisons will help you decide “what to use from each guide” for teaching your students , and how to combine Their Discovering and Their Recognizing with other kinds of learning (including Experiences + Reflections ➞ Principles and sometimes Your Explaining) to help them learn more enjoyably and effectively.
|
two ways to view:
This website is designed to be viewed on a computer monitor, with two pages visible on the left & right. This page belongs on the right side — and if necessary you can use Special-Purpose Links to put section on right side or make a “split screen” with sections on left & right — because its Basic Links open on the left side, and the split-screen format lets you simultaneously see the ideas on both sides. Your browser's Back-Button will work as it should (in the ways you expect) for content on both sides, on the left & right. / At the beginning of many sections you will see the first kind of special-purpose link, or (less often) both kinds of links. If you want one of these links but don't see it, scroll upward until you find the link you want, and then scroll back down to “where you were” in the page.
Or... if you're viewing on a small-screen device, you can open only this page in the full-width window so it will be larger.
three other tips: • Some sections end with an option to see Table of Contents for “what to read next” options. And with general knowledge, probably you already know that... • You don't need a special link to "open only this page" because you can right-click any link and choose to Open in New Tab. • You can enlarge a small diagram by right-clicking it and then Open in New Tab (or New Window that can be relocated and resized), or by “squeezing outward” on a touch screen or trackpad.
a short bio: I'm an enthusiastic educator (with a PhD in C & I ) who wants to share ideas with co-enthusiasts. { a longer bio }
contact-email: craigru57-att-yahoo-daut-caum
|
Your process of discovering begins with
Diagram 1 - Define and Solve:
This iterative Design Cycle (Generate-and-Evaluate) is an
Essential Action, is the foundation of Design Process.
It's used after you
Learn about the Problem-Situation(s),
Define your Objective (for what to make better),
Define your Goals (for an Optimal Problem-Solution).
While you're studying this diagram,
think about a Mystery Question by asking
“why is there an arrow on the right side
of the Cycle to Generate-and-Evaluate?”
and maybe asking two related questions.
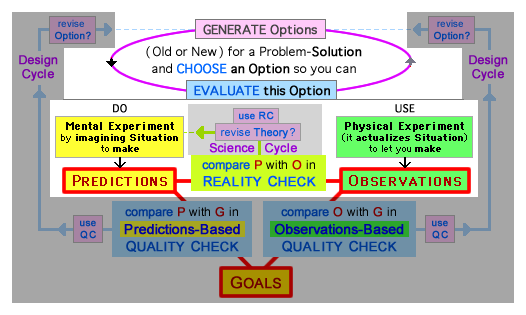
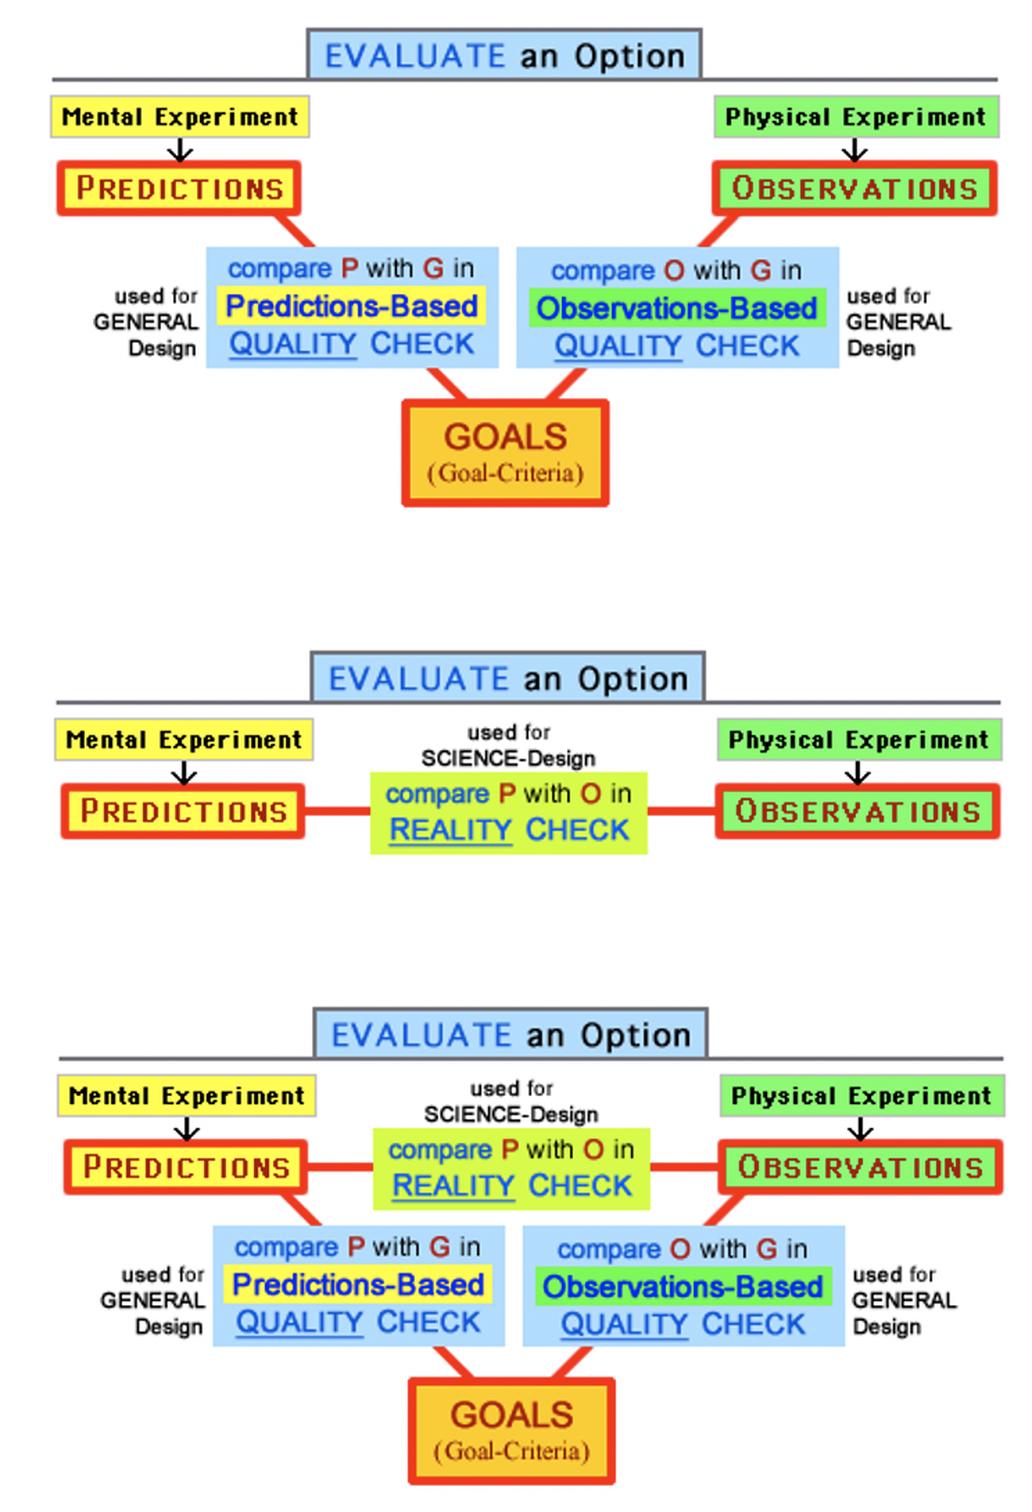
Diagram 2 - Evaluate an Option:
Here is my broad definition for an important term:
an Experiment is any activity (Mental or Physical)
that produces Experiences and
lets you make Predictions or make Observations.
For many years this was my favorite diagram because it
blends
art with logic, integrates Design and Science.
It will be easier to understand Diagram 3 after you
first see all three diagrams simultaneously, so you can get
a “big picture overview” that shows you how they all fit together.
Below is most of Diagram 1 (its bottom part has been removed)
and all of Diagram 2
and most of Diagram 3 (the same bottom part has been removed).
Where is Diagram 2 in Diagram 1 ?
Where is Diagram 1 in Diagram 3 ?
Where is Diagram 2 in Diagram 3 ?
How do the “extra parts” of Diagram 3 (its left & right sides) answer
the Mystery Question? (by explaining why 1 has a right-side arrow)
|
|
|
re: the questions "Where is Diagram X in Diagram Y ?",
most of Diagram 2 is inside “the gray box” of Diagram 1 .
Below is Diagrams 1-plus-2 (on left side) and 3 (right side);
1-plus-2 combines 1 (in Top Part) with 2 (Bottom Part);
Diagram 3 (right) basically combines 1-and-2 (left);
(below you see Diagram 1+ 2 and the Core-of-3)
or in the language of mathematics, 1 + 2 ≈ 3.
But it's only "basically" ( ≈ ) instead of exactly ( = )
because 3 contains an important new Action. It's
Guided Generation that completes a Design Cycle.
Do you see how it answers The Mystery Question?
and why this Action is called Guided Generation?
|
Diagram 1+ 2 |
Diagram 3-Core |
|
|
| |
Diagram 3 - my complete model for Design Process
(it shows Diagram 1 + 2 , and also forming Cycles if we ask "revise ?" )
Now it will be useful to read explanations (above) of
the relationships between Diagrams 1 & 2 and 3,
and how Diagram 3 answers The Mystery Question.
In Diagrams 1 & 3, the word "Cycle" shows that
you can choose the option of using an iterative Cycle so
you can improve an Old Option with Guided Generation when
critical Evaluation motivates-and-guides creative Generation
by revising the Old Option to creatively Generate a New Option
that is a closer match (in a Quality Check) with your GOALS.
{ using a Cycle is optional, as explained in Action-Sequences }
|
Table of Contents
As explained in the Page-Intro, this page will help you develop a deeper understanding of my model for problem-solving Design Process, after you have developed — by using Part 1 of the HomePage (recommended) and maybe (also useful) the section above — a basic understanding of the model.
iou – In late June, I'll add a little more to the introduction (above) and (below) will make a ToC with links to the topics, and maybe will rearrange the topics by organizing them into categories that are symbolized by the three colors.
The Flexibility of my model for Design Process – Four Common Action-Sequences (with Quality Checks & Reality Checks --> Design Question & Science Question) – Cycles of Design – Guided Generation – skillfully Coordinate Your Process –
Learning Design Process will be Easier Than You Think ---- Three Clues for The Mystery Question ---- Integrating General Design with Science-Design (--> 3 Contexts for Science)
deeper understandings of Actions in Design Process: Learning about the Problem-Situation – Defining Goal-Criteria – Defining a Problem-Purpose — @ earlier (Quality Checks & Reality Checks – Cycles of Design – Guided Generation) – making Predictions & making Observations – using Old & New (plus 1st-Hand & 2nd-Hand) –
teaching Design Process: Their Discoveries (as in Part 1 of HomePage) and Your Explanations — before this, Experiences + Reflections ➞ Principles of Design Process — 4 Levels (none, E, ER, ERP); also, my model for Design Process is a family of sub-models (with different levels of completeness & complexity) so a teacher has flexibility in deciding how they want to teach the model.
Design Process is Your Process
 update and iou – This section has been moved into the end of Part 1 in the HomePage.
Think about three essential Actions ( • • • ) and ask reflective self-questions: Do I often ....
• .... use Design Cycles to Generate-and-Evaluate, by Generating Options and Evaluating Options? { in an iterative Cycle of Design, you Generate-Evaluate-Generate-Evaluate-... }
• .... use Quality Checks to Evaluate an Option by comparing my Predictions (of its Actual Characteristics) with my Goal-Criteria (for Desired Characteristics)? { and do I sometimes also compare Observations with Goal-Criteria? }
• .... use Guided Generation to Generate a New Option by Revising an Old Option, so my Evaluation — done in a Quality Check that shows the mismatching between Goal-Criteria and Predictions (or Observations), so I ask “what is causing the mismatches, and what changes would improve the Option?” — guides Generation by showing the inadequacies of an Old Option so I can change it into a better New Option?
more: You can learn more about these essential Actions in sections for Design Cycles and Quality Checks and Guided Generation.
All of these Actions, and others, can be used in metacognitive Thinking Strategies, for example by developing a metacognitive checklist to use while you are Solving (to Coordinate Your Process) and/or afterward (to Reflect on Your Process) so you can Learn More from Your Experience. [ iou – Later, each blue phrase will be a link. ]
iou – For a few days (May 19-22) I'll be working on a big project – about improvising music – that you can see by clicking the link for "improvising" in this section. Saturday, May 23, I'll return to working on Problem-Solving Education in this Models-Page plus the HomePage & Mini-Page.
the flexibility of Design Process
my two claims: I think... • most people use a general Problem-Solving Process that is similar (but not identical) for most things we do in life, AND • this general process is described by my model for Design Process. [use from h#ps0]
This section will explain the General Process (that is described by Design Process) is not identical, even though it is similar.
[ transition needed ] Family of Models -- Lego Bricks & Atoms (+ sequences) -- and you can form an "extended family" when Design Process is combined with Other Models-for-Process.
Options for Actions: The next section describes Action Sequences that people often use while we are solving a problem. These sequences are possible because we have Options for Actions, so we must make Action-Decisions about “what to do next” during a Process of Problem Solving. These common Action-Sequences illustrate how people use a Problem-Solving Process that is similar for almost everything we do, but is not identical, because our Problem-Solving Actions can be combined in many different ways by different people to solve different problems.
[ transition to Lego bricks forming Lego structures, and atoms forming molecules ] [ simple units --(thinking strategies)--> many clever ways to combine, because for optimal PS in many situations it's useful to supplement DP with other models-for-process-@dph#om ]
iou – in late May, I'll condense-and-revise the ideas in this paragraph: But differences occur because The Problem-Solving Actions — including all verbs (Learn, Define, Define, Generate, Choose, Evaluate, Design, Do, imagine & make-use, actualize & make-use, use by comparing, use, revise) — can be combined into MANY different sequences when The Actions are done by different people to solve different kinds of problems. A person will coordinate their problem-solving process by making decisions (how?) about “what to do next” for each specific problem, and with experience – especially when they use metacognition to pursue a learning objective – they will develop customized strategies for each kind of problem, to optimize their process (for the kind of problem they're working on now) and to design a better solution. Their flexible improvising is analogous to the goal-directed improvising of a hockey player. But not the rigid choreography of a figure skater. / Their coordinating-of-process also is analogous to the modular process-of-building when a few kinds of simple Lego Bricks are used to build many different complex structures. With a modular process-of-solving we can use the same Problem-Solving Actions to form many variations of Problem-Solving Process. People can solve a wide variety of problems by custom-building a Process that is similar (but not identical) for most things we do, because each Process is a variation (improvised with modular flexibility) on a basic theme, made by combining the same Actions in different ways. // In a brief description of the 9 Actions, we use experiences to get Information (by making Predictions or making Observations) that we use (along with Goals for a Solution) to Evaluate a Solution-Option, and then we use our Evaluation to Generate a better Solution-Option. { a detailed description of The 9 Actions } { Action-Sequences in Design Process } The framework of Design Process (DP) is constructed from cognitive Actions, as you can see in its cognitive Action-verbs: learn, define, define; generate, choose & evaluate { (do by imagining to make [to predict], use to make [to observe]) and compare }; use, revise, generate; Choose & Actualize.
analogies for flexibility include... the modular flexibility of Lego Bricks ➞ Lego Structures, or atoms ➞ molecules; the improvising of hockey skaters but not the choreography of figure skaters; branch-point decisions that occur when we use roadmaps & flowcharts; a carpenter's tool belt; music theory ➞(scales & chords)➞ music improvising & composing.
two kinds of skaters: When you coordinate your Problem-Solving Process by making Action-Decisions about “what to do next” your flexible improvising IS analogous to the flexible goal-directed improvising of a hockey skater, but IS NOT like the rigid choreography of a figure skater. When people are solving problems, we often use... |
four common Action-Sequences
These sequences occur because they're functionally useful. They tend to occur naturally because – when you're Coordinating Your Process by deciding “what to do next” – you decide that a particular sequence will help you make progress toward solving a problem. Because these Action-Sequences "tend to occur naturally" you don't need to learn the Sequences; instead you can just recognize that Your Actions (in the Sequences) are the Problem-Solving Actions you see in the diagrams for Design Process. [link to "Recognition Learning" in HomePage? compare the two wordings, here & there, adjust]
1 – Cycles of Design (Part 1)
iou – Until this section about "Cycles of Design" is revised (during June 17-18) it's best to just ignore it.
Here are two different kinds of Action Sequences:
1) You do an “ideation phase” with your focus on Generating Ideas-for-Options, with no Evaluating-of-Options;
2a or 2b or 2c) In any of these Action-Sequences you "Choose an Option so you can "Evaluate this Option" NOW, by contrast with "1" when you delay your Choose-and-Evaluate until LATER.
In a cycle of Generate-and-Evaluate, sometimes the two Actions do not consistently alternate as in "Generate-Evaluate-Generate-Evaluate-Generate-..." because other sequence-timings also are possible; e.g. you could "Generate-Generate-Generate-Evaluate-Evaluate-Generate-Generate-Evaluate-Generate-Evaluate-Evaluate..." or do another sequence.
1 – Generate Ideas without Evaluating Ideas: This can be an effective Problem-Solving Strategy, so it's emphasized in many Models-for-Process, as in the "Ideate" phase used by d.school of Stanford. { analysis of all five phases – Empathize, Define, Ideate, Prototype, Test } The sequence used to "Ideate" will be examined later, in Cycles of Design.
You first Generate an Option (1) and then – maybe in your next Action or maybe after doing other Actions so there is a delay – you Evaluate an Option, in one (or more) of these ways:
 2a – one kind of Quality Check: This diagram shows the central part of Diagram 3 (without the text at top & bottom) so the Actions begin with GENERATE Options. In the unshaded region, follow the downward flow of action-verbs — Generate, Choose, Evaluate, DO by imagining to make, compare — and you're seeing a common Action Sequence. Why is it commonly used? Think about each pair of actions, and you'll see the logical motivation: when you're making Coordination Decisions (about "what to do next"), Generate logically leads to Choose (i.e. Generate ➞ Choose), then Choose ➞ Evaluate, and so on. Notice how each Action leads to the next Action. Why? Because when a person does one Action, they often think “I can make progress (toward Solving the Problem) if I use the results of this Action to do my next Action.” / spoiler alert: Then in the region that is lightly shaded (to show that it's optional) you see a Third Action-Sequence (it's the Answer for the Mystery Question) when you follow the left-side arrow upward — compare ➞ use ➞ revise ➞ Generate (to complete a Design Cycle with Guided Generation) — in a continuation that is done often, but not always, because you have alternatives for your Next Action.
2b – another kind of Quality Check: Study the right-side diagram that's below or (better for viewing it) on the left side. It shows another possibility when you reach a branch point. Your decision to Evaluate This Option is followed by another decision; you can choose to Evaluate with either kind of Quality Check, by using Predictions (as in left-side diagram) or using Observations (in right-side diagram). These two Quality Checks are analogous. In both you do similar verb-Actions in similar Action Sequences (Generate ➞ Choose ➞ make ➞ compare) that you choose because you have similar logical answers when asking “how can I make progress? what should I do next?”
2c – a Reality Check: The middle diagram shows how you “use Science-Design during General Design” when you are surprised because Predictions are not matched by Observations. When this happens, an Evaluative Comparison (of Predictions & Observations) can help you decide how closely your personal Theory about “how the world works” (and thus “what will happen”) matches “how the world really works” (and “what really does happen”) in a Reality Check. / coordinating Your Process: After this Sequence (make-and-make ➞ compare in Reality Check) you can decide whether to continue (use ➞ revise) and Generate a Revised Theory, or to respond in another way ; or you can choose a different Action.
|
 |
 |
In this complete Design Cycle with a
Predictions-Based Quality Check
your Action-Sequence is Generate,
Choose, DO-make, compare, use.
|
In this complete Science Cycle with a
Reality Check
you Generate { Theory-Options }, Choose,
DO-make + USE-make, compare, use.
|
In this complete Design Cycle with an
Observations-Based Quality Check
your Action-Sequence is to Generate,
Choose, USE-make, compare, use.
|
Below are alternate versions of the Isolation Diagrams. These offer
the benefit of simplicity, making it easier to focus on the actions being done. But
overall I like the diagrams above because their “big-picture context” is a reminder that all
of the Options-for-Action are available, even when you now are doing only some of the Actions.
But both sets can be useful, and a teacher can decide whether to use one set or the other, or both.
e.g. You can begin with simple "total isolations" (below) to clearly show students each Sequence,
then shift to "in-context isolations" that help students understand the concept of "branch points"
so they can improve their skills with making Action-Decisions to Coordinate Their Process.
two other options that a teacher can decide to use or not-use:
each Sequence can have a simple summary (below) or a detailed summary (above).
|
 |
 |
 |
This is a Design Cycle that uses a
Predictions-Based Quality Check.
|
This is a Science Cycle that uses a
Reality Check.
|
This is a Design Cycle that uses an
Observations-Based Quality Check.
|
1a – Cycles of Design (Part 2)
You can use Cycles of Generate-and-Evaluate in different ways. You can...
use Complete Cycles: You complete one Cycle of Design when you choose to do Generate-and-Evaluate (i.e. Generate-Evaluate). Or you complete multiple consecutive Cycles, as in Generate-Evaluate-Generate-Evaluate-Generate-Evaluate-... / But even though the diagrams of Design Process show "iterative Cycles of Design" and imply complete Design Cycles (as in Generate-Evaluate-Generate-Evaluate-...), my model is flexible because our Observations-of-Reality show us that designers often will...
use Incomplete Cycles: Early in their process of Solving a Problem, experts often focus on “creative ideation” by doing multiple Generations before they begin to Evaluate, as in Generate-Generate-Generate-Generate-Evaluate-... Later in their process, after they have Generated Multiple Options and have Evaluated Multiple Options, and they have made “short list” of top contenders, they can do Competitive Comparisons – {Evaluate/Evaluate/Evaluate} – by combining Multiple Quality Checks (done for Multiple Options) in order to construct a ranking of Relative Quality Status (for The Options) because this will help them Make Decisions about The Options.
iou – before mid-June, I will develop a better transition between 1a (above) and 1b (below), and parts of 1b will be moved upward into 1a.
A common Strategy for Problem Solving uses Incomplete Cycles when designers choose to complete a Multiple Generations with the intention to...
1b – use Guided Generation in a Cycle of Design
creatively Generate Multiple Options: How and Why? After you Generate an Option you can Evaluate This Option as above in the three Check-Sequences, OR you might decide to Generate Multiple Options as in a creativity-stimulating strategy of Generation with Delayed Evaluation (i.e. Brainstorm-then-Evaluate or Brainstorm-then-Edit) when you delay Evaluation until later. This would involve a simple decision to focus on creative Generation by “continuing to Generate Many Options” instead of “Evaluating One Option.”
In a Design Cycle you Generate-Evaluate-Generate-Evaluate-... But if you Generate Multiple Options instead it's just Generate-Generate-Generate-... in your conscious thinking; but your subconscious thinking usually is doing some Evaluating (at least a little bit, with Evaluating or Evaluating) and this makes your process more like Generate-Evaluate-Generate-Evaluate-Generate-Evaluate-... before you decide to consciously focus on Evaluation when you "Choose an Option so you can Evaluate This Option."
These two Actions – when you Generate Options & Evaluate Options – form the solid foundation of Design Process. They provide a “big-picture overview” of your Problem-Solving Process, and they can serve as a simple Metacognitive Checklist when you ask “did I use an effective overall Process? did I creatively Generate multiple Ideas-for-Options, and logically Evaluate these Ideas-for-Options?”
iou – Soon, maybe in mid-June, I will revise this section (to reduce duplications,...) but as-it-is I think the main ideas are clearly described, so you can understand them.
other possibilities: In addition to the sequences-with-comparisons (Quality Check, Quality Check, Reality Check) plus Generating Multiple Options, many other kinds of Action Sequences are possible (by making different decisions at branch points), and each of these can be useful in some Problem-Solving Situations.
timings of Actions: Design Process can be represented by many different Action-Diagrams. (how & why?) In these diagrams, what is (and isn't ) being shown? Based on your experiences with the Action Sequences, you should be able to answer this question: Why is an Actions-Diagram like a “time-lapse photo” but not a snapshot photo?
two arrows – a Minor Mystery and Major Mystery: Before you read this paragraph, I suggest reading "The Mystery Question" in Part 1 of the HomePage. / In a diagram for Design Process, I think the left-side arrow (for Generate➞Evaluate) is not much of a Mystery, because there are two obvious reasons for it: logical necessity because an Option must be Generated before it can be Evaluated, and problem-solving wisdom because an Option should be Evaluated (by using Comparisons in “ Checks”) before – as in the “bottom box” of Diagrams 1 & 3 – it is Chosen and Actualized. / If you haven't yet solved The Mystery (of the right-side arrow), here is a spoiler alert: By contrast with the left-side arrow, a reason for the right-side arrow (for Evaluate➞Generate) is less obvious, so I ask The Mystery Question and encourage you to construct The Mystery Answer that is Guided Generation.
iou – Sometime (maybe in mid-June), somewhere in this set of sections (about Action Sequences) I will describe how – as described in Adventures for Thinking – "the short-term Actions and Action-Sequences of Design Process are used to form the long-term Thinking Strategies of other Models-for-Process (that propose a framework for thinking), e.g. in d.school's five hexagons: Empathize, Define, Ideate, Prototype, Test."
Two Useful Questions
The Design Question: When you compare an Option's Actual Properties (either Predicted or Observed) with the Desired Properties that you have defined as Your Goals for an Optimal Solution, why is this comparison called a Quality Check? Because you're asking “how high is the Quality?” (with Quality defined by your GOALS) when you ask “how close is the match?” You can define either question — “how high...” or “how close...” or both — as The Design Question (aka The Engineering Question) that you ask for Evaluation during General Design (aka Design).
The Science Question: You can be motivated to compare Predictions with Observations – in a Reality Check – in two ways. Maybe you are doing a project for Science-Design, and in the Science Project your Main Goal is to test a Theory so you intentionally use a Reality Check. Or maybe you're doing a project for General Design and during this Design Project you unintentionally do a Reality Check because you notice a mis-match between Predictions
& Observations, so you answer “yes” when asking “am I surprised?” with The Science Question.
Guided Generation
In the three common Action Sequences, if you use a Quality Check {or a Reality Check} and then you decide to "revise Option" {or "revise Theory"} and complete a Design Cycle {or a Science Cycle} you are using...
Guided Generating: You do this when you are motivated to ask "revise Option?" (in Diagram 3) because you want to Generate a New Option that has a closer match between its Actual Properties (in your Predictions or Observations) and the Desired Properties (that are your GOALS for an Optimal Solution). During this process of critical-and-creative Guided Generation you are using critical Evaluation to motivate-and-guide your creative Generation. How? Your Quality Check provides guiding when you notice the differences between Actual Properties (of This Option) and Desired Properties (in your GOALS) so you ask “what is unsatisfactory, and how can these deficiencies be improved?” Your answers will help guide your critical-and-creative thinking when (for example) you use a creative strategy of “trying out” multiple New Options in quick iterative Cycles of Generation-and-Evaluation in which you “Generate-Evaluate-Generate-Evaluate...” / Do you see how this paragraph answers The Mystery Question(s) by explaining why-and-how people use Guided Generation?
During these repeating Cycles of Design you typically Evaluate by using Mental Experiments — because they're quick-and-easy, compared with Physical Experiments — and this is why Predictions-Based Quality Checks are the most common kind of Action Sequence. { although Mental Experiments are more common, Physical Experiments can be more useful & more important }
Options for Action: When you respond to an unsatisfactory Quality Check, you can decide to Revise the Old Option to Generate a New Option, or choose another Next Action, because you have alternatives: you might decide to use This Old Option as-is (with no revision) or revise This Old Option (with Guided Generation) so you Generate a New Option that is only Semi-New, instead of Inventing a New Option that is More-New, or even (although maybe impossible?) is Totally-New. Or if you consider Another Old Option, you can Evaluate it and use it as-is, or revise it to Generate a New Option. {* five kinds of strategies for creatively Generating Options } / Or you can shift to another kind of Action (like Learning More, or re-Defining Goal-Criteria, or Designing another Experiment); and of course you can "delay work on this Problem-Project [and do something else for awhile], or abandon it." (quoting from the bottom of Diagram 3)
skillfully Coordinate Your Process
You coordinate your Problem-Solving Process when you ask “what is the best way to make progress in my process?” and decide “what to do next” and do this Action. How? To make skillfully effective Action-Decisions you combine cognitive-and-metacognitive awareness of your process (of “where you are” and “where you want to go” in your process, and when you're at a branch point) with conditional know ledge about your Options-for-Action (by knowing what the Options are, and what each Action can do, and the conditions when a particular Action can be useful)
You will improve your process-coordinating skills when you develop-and-use your own mental models for problem-solving process. In a useful analogy,
You can use two kinds of maps,
to coordinate your process, and
to drive from one place to another:
These three Action-Sequences (and others, like Generating Multiple Options with Brainstorm-then-Edit) illustrate how people use creative-and-critical thinking in many different ways while we are trying to solve problems and make things better. When you use these diagrams for problem solving it's analogous to using a map for traveling (by driving, biking, walking, or riding a bus) when you move to a new city. An external map gives you an accurate “big picture overview” of the city's physical geography and your options for traveling; this helps you form your own internal map (your mental map that's a mental model, is a mental representation) for the physical geography. A physical map helps you learn your options when you're moving from one place to another. Similarly, using Diagram 3 as a “flowchart map” will help you understand your options-for-Actions at the branch points where you can choose the paths you will travel in your problem-solving journey; and it helps you develop your internal mental maps of cognitive geography. / And with both maps, usually your map-using is temporary. After awhile, with experience – especially when you use metacognition consistently & effectively – you'll KNOW the physical geography of the city (and your options-for-traveling), and with practice you'll KNOW the cognitive geography of problem solving (and your Options-for-Actions). In another metaphor, you can view your Actions as problem-solving tools — analogous to those in the toolbelt of a carpenter (or mechanic, electrician, plumber,...) — and metacognition helps you improve your tool-choosing wisdom and tool-using effectiveness.
Because you already have done a lot of problem-solving practice in your past, instead of learning new strategies-for-process you can — by doing metacognitive reflections on your “process of thinking” — be recognizing your old strategies-for-process and connecting your process-experiences (old & new) with the process-principles in Design Process.
Whether you're using a roadmap or process-map, the map is useful only if it's accurate, and Design Process is accurate.
iou – during mid-April, a few of these ideas will be blended into the section above: These three Action-Sequences (and others, like Brainstorm-then-Edit) illustrate how people use creative-and-critical thinking in many different ways while we are trying to solve problems and make things better. When you use these diagrams for problem solving it's analogous to using a roadmap for traveling (by driving, biking, walking, or riding a bus) when you move to a new city. An external map gives you an accurate “big picture overview” of the city's physical geography and your options for traveling; this helps you form your own internal map (your mental map that's a mental model, is a mental representation) for cognitive geography. A physical map helps you learn your options when you're moving from one place to another; similarly, using Diagram 3 as a "flowchart map" will help you understand your options-for-Actions at the branch points where you can choose the paths you will travel in your problem-solving journey. But in both cases, usually the map-using is temporary. After awhile, with experience — especially when you use metacognition consistently & effectively — you'll KNOW the physical geography of the city (and your options-for-traveling), and with practice you'll KNOW the cognitive geography of problem solving (and your Options-for-Actions). And with another metaphor, you can view your Actions as problem-solving tools, and metacognition helps you improve your tool-choosing wisdom and tool-using effectiveness.
|
three common Action Sequences – Part 2
 This section is in a gray box to show that it's optional, is a "Part 2" that duplicates much of the information from Part 1. But it can provide “added value” if you're in the mood for learning the sequences in a new way, with a new kind of description with ⊡'s. Or you may want to explore the educational benefits produced by the two wide scopes of Design Process with my answers for asking “what? why? so what?” This section is in a gray box to show that it's optional, is a "Part 2" that duplicates much of the information from Part 1. But it can provide “added value” if you're in the mood for learning the sequences in a new way, with a new kind of description with ⊡'s. Or you may want to explore the educational benefits produced by the two wide scopes of Design Process with my answers for asking “what? why? so what?”
Here are three Action-Sequences (⊡ ⊡ ...) that people often use:
⊡ ⊡ ⊡ ⊡ ⊡ As described above {and shown in the highlighted parts of left-side diagram below}, in one kind of Action-Sequence (⊡ ⊡ ⊡ ⊡ ⊡) after you ⊡ Generate Options you ⊡ Choose an Option {in a second ⊡-Action}; to Evaluate this Option you can {in a set of ⊡-Actions} DO a Mental Experiment to make Predictions, and {in a fourth ⊡} you compare these Predictions with Goals in a Predictions-Based Quality Check; and maybe {it's an optional fifth ⊡} you "use QC" by asking "revise Option?" in a Design Cycle.
⊡ ⊡ ⊡ ⊡ ⊡ In another Design Cycle that has analogous ⊡-Actions,* you Generate & Choose, then to "Evaluate this Option" you USE a Physical Experiment {as in right-side diagram} to make Observations that you compare with Goals in an Observations-Based Quality Check; and maybe you use QC and ask "revise Option?" {* both Design Cycles have the Actions of... ⊡ Generate, ⊡ Choose, ⊡ DO/USE to make, ⊡ compare, ⊡ use revise. }
⊡ ⊡ ⊡ ⊡ ⊡ ⊡ People can do Science-Design in different contexts. Here I'll describe {and you can see in the center diagram} how you Test Your Theory during a project for General Design: first, you ⊡ Generate Options, and ⊡ Choose an Option that you Evaluate in two ways, when you ⊡ DO a Mental Experiment to make Predictions, and ⊡ USE a Physical Experiment to make Observations; then you ⊡ compare the Predictions and Observations in a Reality Check and ask “am I surprised?” with The Science Question; if you answer “yes” (because Predictions are not matched by Observations), maybe you will ⊡ use RC by asking "revise Theory?" and if you decide Yes you will complete a Science Cycle by using Guided Generation to revise the Old Theory and Generate a New Theory; but you may decide No because you checked the Reality Check and found errors in its Predictions or Observations, or due to the influence of Cultural-Personal Factors in your Goals for a satisfactory Theory.
|
|
|
In a complete Design Cycle with a
Predictions-Based Quality Check
your Action-Sequence is Generate,
Choose, DO-make, compare, use.
|
In a complete Science Cycle with a
Reality Check
you Generate { Theory-Options}, Choose,
DO-make + USE-make, compare, use.
|
In a complete Design Cycle with an
Observations-Based Quality Check
your Action-Sequence is Generate,
Choose, DO-make, compare, use.
|
These three common Action-Sequences — when you Evaluate in a Predictions-Based Quality Check, Evaluate in a Reality Check, Evaluate in an Observations-Based Quality Check — are highlighted (in areas that are unshaded & lightly shaded) in the three isolation diagrams. { a reminder: instead of Learning you are Recognizing. }
Why are these Action-Sequences commonly used? Because in each sequence “the next step” is functionally useful in helping you solve the problem. How is it useful? Because in Action-Sequences, including these & others, typically the sequence occurs when the result of one Action is used in the next Action. For example, after you ⊡ Generate one or more Options, ⊡ you Choose an Option that you want to Evaluate; ⊡ then with an Experiment you make Information (you DO a Mental Experiment to make Predictions, or USE a Physical Experiment to make Observations, or you do both), and ⊡ you compare the Information you've made (it's the Predictions or Observations) with Goals (in two kinds of Quality Check) or with each other (in a Reality Check); ⊡ then maybe you use this Evaluative Check to "revise" and Generate a New Option. / Then you can – as one alternative – decide to begin a new Action Sequence, when "first [after Generating Options] you Choose an Option to Evaluate." |
|
learning Design Process
will be easier than you expect:
Initially you could justifiably think “Diagram 3 is complex and will be difficult to understand,” but learning will be easier-and-better than you think because...
you will learn the model in easy-to-do steps: Learning is easier because you begin by understanding the simpler Diagram 1+2,* then seeing how these “logically fit together” to form Diagram 3.
the problem-solving process is logically organized: Learning is better because, reinforcing our intuitive common sense, scientific research shows the benefits of organizing knowledge. / The apparent “initial complexity” of Design Process becomes actual “eventual simplicity” when students understand how the actions combine to form a logically organized problem-solving process. And when they recognize their own problem-solving process in Design Process. Both of these factors – organization and familiarity – help their model-understanding and their model-using become psychologically intuitive for them.
learning in easy steps: Using this page will make your process of learning easier than you would expect IF you began by seeing Diagram 3, so you justifiably were thinking “this is too much, it's too complex, and understanding it will be difficult, maybe impossible.” Why will it be easier? Three reasons are because... • instead of the "IF" (with the complex Diagram 3) you will begin with the simpler Diagrams 1 & 2 so you will learn the Actions of Design Process in easy-to-do steps; • and the Actions of Design Process are comfortably familiar because they are Your Actions, they are “familiar old Actions” you will Recognize, instead of “strange new Actions” you must Learn; and the Actions of Design Process are logically organized. { more - why these reasons will make your learning easier and better }
three questions will help you
answer the Mystery Question:
What? In the 1st Diagram ("Define and Solve"), why does The Cycle have arrows on both sides? It's easy to understand its left-side arrow (from Generate to Evaluate) — stop reading and “think about why” if you want to self-discover the reasons — because you must Generate An Option before you can Evaluate This Option, and you should Evaluate an Option before you actualize it with Actions. But there is...
• a mystery question: Why does the cycle have a right-side arrow, from Evaluate to Generate? Think about this, and then ask...
• a similar question: While you're exploring Diagram 2 ("Evaluate An Option"), ask yourself “after I Compare Predictions with Goals in a Quality Check and decide that the quality-of-matching isn't fully satisfactory, what is a useful next action?” And continue by asking...
• a related question: The right side-side arrow points from Evaluate to Generate. Therefore, ask “after I critically EVALUATE an Old Option, how can this help me creatively GENERATE a New Option?”
All of these are basically the same question. You can answer it with your own thinking, then confirm what you have discovered in the 3rd Diagram that is followed by my brief explanation. And a detailed explanation is in a detailed explanation.
a strategy for instruction: A teacher can use these three questions to “guide the discoveries” of their students, to produce an optimal level of challenge that lets them have more fun and get more satisfaction during their process of learning-by-discovering.
 iou – during April 6-10, I'll write an introduction to explain how Design Process integrates the methods people use for General Design and Science-Design, by contrast with most models-for-process that – as you see in the diagrams – describe the process for only-Design (top) or only-Science (middle) but not for both Science-AND-Design (bottom) as in Design Process. iou – during April 6-10, I'll write an introduction to explain how Design Process integrates the methods people use for General Design and Science-Design, by contrast with most models-for-process that – as you see in the diagrams – describe the process for only-Design (top) or only-Science (middle) but not for both Science-AND-Design (bottom) as in Design Process.
my favorite verbal-and-visual representation...
was Diagram 2 (to "Evaluate An Option")* due to its combination of art-and-logic, with spatial relationships & elegant symmetries in the 3 Comparisons of 3 Elements (Predictions, Observations, Goals - P O G) for two Quality Checks and a Reality Check; the color-codings for Elements (yellow, green, gold) and Comparisons (yellow-green, blue), plus blue & black text. [ iou – during March 9-10, I'll be revising this section. ] This diagram was my favorite – 🙂 – and I hope you also will like it, will appreciate its logical beauty and the principles it summarizes.
* I say "was" because now it's in second place behind Diagram 1+ 2 (at left) that is my new favorite because it shows The Cycle of Design (in 1, the Top Part) and also The 3 Comparisons (in 2, the Bottom Part) so 1+ 2 summarizes two essential features of Design Process.
When the 3 Elements (P & O, G) are used in 3 Comparisons (in 2 Quality Checks for Design, and 1 Reality Check for Science) this leads naturally to the Evaluations that we intuitively use for Design & for Science, including Science-during-Design. This logical integrating of Design-with-Science in the diagram* will help students understand how they can improve the logical integrating of Design-with-Science in their thinking when they internalize this logic with experience in problem solving. They will get this problem-solving experience when they practice using the diagram's comparative Evaluations for General Design (aka Design) and for Science-Design (aka Science) by using comparative Quality Checks (to ask The Design Question) and using a comparative Reality Check (to ask The Science Question). { * Design and Science are logically integrated in Design Process; by contrast, most other models-for-process describe either Design or Science, but not both. } { more about connections between Design and Science } |
We can use Design Process to help students
develop-and-apply Thinking Strategies for
metacognitive Self-Regulated Learning:
This is one of the most educationally beneficial ways we can use Design Process.
why? Based on abundant research, we know that metacognition is highly effective for helping students improve their academic skills (in many ways, including scores on standardized exams) and social-emotional skills.
what? Two effective strategies are metacognitive self-questioning and (especially) metacognitive Self-Regulated Learning; combining these is much more effective than either by itself. { You can see an overview of research results° in a report from Perplexity AI. }
how? { iou – during mid-June, I'll write an explanation for "how". Before then you can see the basic ideas in Slides 62-65 of my Idea-Summary in PowerPoint. }
combining models-for-process: [ iou – before mid-June, here I'll briefly describe how Design Process (DP) can be combined with other models-for-process, in direct applications (like using DP during POE) and indirect applications like supplementing the concepts of Design Process with the concepts of d.school (emphasizing the values of empathy and of developing & using "mindsets" that make your PS-Actions more effective). I'll write this section by condensing ideas from an overview of Combining My Model with Other Models. ]
[ before mid-June, I will describe how – as described in Adventures for Thinking – "the short-term Actions and Action-Sequences of Design Process are used to form the long-term Thinking Strategies of other Models-for-Process (that propose a framework for thinking), e.g. in d.school's five hexagons: Empathize, Define, Ideate, Prototype, Test." ]
[ and here are some extras, thought-about during June 2026: expanding "how to PS" by adding reactive-proactive-protective, in addition to old (from early 2000's) five categories for Goals (i.e. for what to make better), because all of these are part of the "core thinking-concepts & edu-philosophy in DP" about PS, but are not part of the "core verbal-and-visual representations of DP". / Mental Models (only strategies, without structures, although during April I'll think about how these "fit into" the framework of DP, with deeper insights about how to do particular Actions, in action-verbs. ]
[ iou – Below is the first in a series to explain features of Design Process — Experiments (done Mentally & Physically), making Predictions & Observations, using Old & New, First-Hand and Second-Hand,
Experiments produce Experiences
In the context of Design Process, an Experiment is any situation that produces Experiences and provides an opportunity to generate Experimental Information when you make Predictions (by imagining in a Mental Experiment ) or you make Observations (during the actualizing in a Physical Experiment ); i.e. any Prediction-Situation is a Mental Experiment , and any Observation-Situation is a Physical Experiment .* Therefore instead of seeing "Experiment" (in Diagrams 2 & 3) and thinking “I rarely do experiments,” by thinking “Experiments produce Experiences” you can recognize that “many of my everyday Experiences are Mental Experiments (when I'm imagining ‘what will happen’ to Predict) or involve Physical Experiments (when my Experiencing-and-Observing occurs due to actions by myself or others, or just due to circumstances-of-life).” Your Experiments (Mental & Physical) include many things you do, and most things you experience.
In the previous sentence you see distinct differences between Mental Experiments & Physical Experiments, and thus in the descriptions I use for Design Process. You
"DO a Mental Experiment (Mental Experience) by imagining Situation to make Predictions" but
"USE a Physical Experiment that actualizes Situation in Physical Experience and lets you make Observations."
In a Mental Experiment there is direct causal connection because when you actively imagine you PRODUCE Predictions; but there is no direct causal connection in a Physical Experiment that merely ALLOWS Observations, because you decide how you will Observe and this (not the Experiment) determines the quantity & quality of your Observations. Things are simple when you DO a Mental Experiment and you have total control over what happens; but with a Physical Experiment there are many complex variations, and your control of the Situation can range from a lot (when it's mostly due to your actions) to much less (when it's mainly due to the actions of others, or due to circumstances-of-life beyond human control). { iou – later I'll return to this paragraph, will re-think and re-write. }
* You get Experimental Information from Experiences that are old & new, first-hand and second-hand.
Experimental Design: Designing Experiments is a valuable skill,* when you ask-and-decide "what will I think about?" (in Mental Experimenting to produce Mental Experiences) and "what will I do?" in Physical Experiments that produce Physical Experiences. A general strategy for inventing new Experimental Systems (E-Systems) is to creatively Generate Options for many possible E-Systems and “run them” in quick-and-easy Mental Experiments — to imagine “what kinds of things might happen, and what could we learn that might be interesting or useful” to make Predictions — and maybe Choose an E-System to actualize in a Physical Experiment. And you can remember (or find) old E-Systems, and choose to actualize one of them, as-is or modified. Or shift from this divergent search to a convergent search with focus, by asking “what do I want to know, and what Experiments will help me get this Information with useful Predictions or Observations?”
* Experimental Design is valuable in everyday life because it lets you Design Your Experiences (Mental & Physical) and thus Design Your Life. And it's the main focus of action in Research Science, for science & engineering; usually the most important activity (e.g. in requesting grant money and writing journal articles) is the creative-and-critical Designing of Experiments, trying to generate knowledge that will be interesting and useful.
iou – later, but probably not until April, I'll expand this section by using ideas from an earlier long HomePage.
|
iou – March 17-21, I'll condense-and-revise the sections below, which explain how we make Predictions and make Observations, how we use Old-and-New) during Design Process. These sections are in a "brown box" to show that they need to be revised.
Predictions and Observations
how we make Predictions:
inductive reasoning: The most common way for a person to predict — it happens every time you “imagine what will happen” so Diagram 3 explains that “by imagining a Situation” you "make Predictions" — is by using logical experience-based induction. You do this by assuming that “what happened before (in similar situations) will happen again.” Asking “what is similar (in previous Situations & the current Situation) and what is different?” will help you do better Predicting, and have a level of confidence that is more appropriate. (level of confidence,
deductive reasoning: But in some Situations a person uses logical theory-based deduction. How? Based on a Personal Theory (that often agrees with a Scientific Theory, but not always)* you use if-then logic by thinking “if My Theory (about how the world works, and what will happen) accurately corresponds to reality and what I expect to occur does occur, then will happen” and you fill the blank with your Prediction. {more about deductions}
deductive-plus-inductive: People usually combine these two kinds of logic (inductive & deductive) when we make Predictions, with the balance differing from one Prediction-Situation to another. This also happens in computer simulations — in forecasts for weather or climate; for football (in predictions about games, pre-game analysis of videos & data,...); with GPS (in suggestions for routes, predictions of ETA's); and in other simulations — that use a combination induction-and-deduction, with the balance differing from one kind of simulation to another.
things we predict : Obviously people predict “what will happen” or (more accurately) “what probably will happen” and you use these Predictions in Reality Checks. But in "what will happen" the "what" often predicts the characteristics of an Option that is being Evaluated (in a Quality Check) as a possible Problem-Solution. And when your objective is to design a Strategy – especially when it's a Strategy to improve a Relationship – you may predict the behaviors of people, of yourself or others, or both. Or during Experimental Design you can predict “what might happen” and “what could be learned” if you do an Experiment. And there are other possibilities, like those described in a research report about these four paragraphs that I will format – by writing a Table of Contents and making links (in that page and in this section) – during September 23-25.
how you make Observations:
When you DO a Mental Experiment "by imagining" you always "make Predictions." By contrast, a Physical Experiment just "lets you make Observations" because sometimes you USE the Experiment to make Observations, but you don't have to do this, so you don't always do it.
How and What? In some Experimental Situations you can make Observations directly with your internal human senses (to see, hear, touch, taste, smell) and/or indirectly with external measuring-instruments (a ruler, weighing scale, watch, thermometer,...). These two source-types let you get information that is qualitative or quantitative, can be represented verbally (with words,...) or visually (in graphs, photos or videos,...)
or mathematically (with numbers, equations,...) or in other ways.
simultaneously Observing-and-Predicting:
This occurs continuously in your everyday life because your Actions can be mainly (but not only) Mental, or mainly (but not only) Physical, or plenty of both with Physical-plus-Mental.
It will be easier to understand the what-how-why by thinking about examples from “ball sports” like basketball, football, and soccer. A basketball player who has the ball is making Observations (about where all players are now) AND is making Predictions (about where they will be soon) that are being compared with Goals (in Quality Checks) so they can make an Action-Decision about where to pass the ball, or to dribble it or shoot it. A skilled player can do the Problem-Solving Actions in Diagram 3 very quickly (in their system of subconscious-plus-conscious) so they can make a quick Action-Decision that is likely to be productive. At the same time, all other players (offensive & defensive) are Observing-Predicting-Comparing so they also can make productive Action-Decisions about where they will move and what they will do.
In your everyday Actions, you do similar “simultaneous Observing-and-Predicting” in a wide variety of different ways.
Defining Goals
Defining Goals is special kind of "Prediction" (actually it's "Predicting" because it isn't true Predicting but has many similarities along with a key difference), not Predn for probab of happening, but for imagining the desirability of future Goal-State state IF it happens. / true Predn --> WHAT might happen + PROBAB (HOW LIKELY)
into #eae
With a broad definition of Experiment most of your everyday Experiences involve Mental Experimenting and/or Physical Experimenting. The "and/or" includes "and" because people often do both kinds of Experimenting simultaneously. / pure Mental (common) but pure Physical (uncommon, usually is Physical-plus-Mental, P-and-M, @ws#dpmo-Intro for Actions, M P M-and-P)
using Old and New:
Diagram 3 says "GENERATE Options (Old or New) for a Solution" because you can Invent a New Option, or maybe – instead of “reinventing the wheel” – you will Find an Old Option and “use a wheel” (as-is or modified) if this will be an effective Problem-Solution. Both of these Actions, by Inventing or Finding, are ways to Generate an Option.
More generally, Old Knowledge (that already exists) can include Options (for a Solution or Theory) and also Problem-Situations & associated Solution-Goals; plus Experimental Systems (Mental or Physical) & associated Predictions or Observations.
You get Knowledge from Experiences, and your Total Experiences — in your First-Hand Experiences (happening to you) and Second-Hand Experiences (happening to others, but known by you) — include Knowledge that is Old (it's remembered in your personal memory or is found in our collective memory that is “culturally remembered” with books, web-pages, audio & video, etc; or it's learned directly from another person) so it's Old, but also is New (is being experienced now in your sensory perceptions & your thinking-and-feeling, is both conscious and subconscious). { finding-and-using Old Knowledge is Mode 2A in the 10 Modes of Action }
Your total experiences include your first-hand experiences with events you personally Observe (that you remember in your Personal Memory, from your own experience in the distant past or recent past) plus the second-hand experiences (found in our Collective Memory) that were Observed by someone else, then later (in a report or recording) you hear it and/or see it, or (in a web-page, tweet, book,...) you read about it.
combining Old and New: You want the best of both, for productive thinking that effectively combines relevant knowledge with creative thinking and critical thinking. You want a solid foundation of knowledge about what has been & now is (the Old & Present) plus flexible thinking that lets you freely imagine what could be (the New & Future). During your Process of Problem Solving when you're trying to Design a Satisfactory Solution, this combination lets you consider the full range of Old Options AND expand this range by creatively inventing New Options. / How? By using five Thinking Strategies Thinking Strategies for creatively using cognition-and-metacognition to Generate New Options. Thinking Strategies to Generate New Ideas.
extra idea: choose to design (to invent or modify or find, or find-and-modify) a
two ways to learn:
iou – I'll revise this section during February 25-28, by revising the ideas below and supplementing them with ideas from other sections:
You can improve your understanding by learning from your discoveries – as in a Discovery Page — and also from my explanations.
Students are learning in both ways when you ask them to carefully study three diagrams — (Define and Solve), (3 Comparisons of 3 Elements), (Guided Generation in Design Cycles) — by examining each diagram and...
• asking “what is the meaning?” for every word & phrase, and (in the diagrams and their explanations-with-text) for the colors;
• asking “how are these two things connected?” for every arrow;
• thinking about “why the spatial relationships are logically meaningful” ...
and also (during each • ) thinking about how all of this describes the actions you use while you are solving problems. When you reflect on your own experiences, your Process of Discovery will become a Process of Recognition because you will recognize that Design Process accurately describes the Problem-Solving Actions that you use when you are solving problems. / also: Because problem solving has two wide scopes, people use a similar Problem-Solving Process for most Problem-Solving Activities, and these include almost everything we do in life.
some historical context: Originally this section was at the beginning of Part 1 in the HomePage but in "Part 1" the main goal is to help you understand my model for Design Process (for the Design-Thinking Process that is Problem-Solving Process) and I decided "this is Too Much Information, I should let a reader quickly begin learning about the model." Therefore I deleted most of it in Part 1, but moved some of it into using the model for education and moved all of it to here:
How? During your adventure of active Discovery Learning, you will “learn by doing” with stop-and-go reading* so my questions & clues can guide your explorations when you study this diagram for my model of Design Process. / * Even though you won't have continuous “speed reading” I think your ratio of “ideas learned / time invested” will be high and you'll enjoy the process, and the results will be satisfying. To achieve these goals — enjoyment & satisfaction, with reasonable time-efficiency (in the ratio of learning/time) — plus learning-effectiveness (so the result is a thorough-and-accurate conceptual understanding of the model, producing an ability to skillfully use it and teach it ),...
for you I think the best way to learn is with Discovery Learning by reading Your Discoveries (it's below the next paragraph).* But if you want to reduce your Discovery Learning in order to increase your Direct Learning — and probably increase your ratio of “ideas learned / time invested” ? — you can skip Your Discoveries and go to My Explanations where I explain the main features of Design Process. / * Instead of reading, if I was there with you (and we had time & patience) we could improvise a conversational guiding (of Your Discoveries) that would be better.
for your students, I think the best way to learn is a “hybrid” teaching strategy that combines... • providing Design-Thinking Experiences and • promoting Metacognitive Reflections that increase their Awareness-of-Actions (so they Recognize Their Actions, and Learn More from Their Experiences), plus • guiding their active constructing of Principles for Design-Thinking Process, with Experiences + Reflections ➞ Principles that is mostly Recognition Learning (it's one kind of Discovery Learning, with Self-Discoveries) guided by you. Later, at some point they can do a related kind of guided Discovery Learning when they study diagrams for Design Process — as in this section, but with you converting my written guiding (with questions, tips, clues,... and explanations) into your conversational guiding — but now students will be Recognizing Principles that they already have Discovered, and they will be Organizing the Principles by using the logical verbal-and-visual structure of Design Process. { more about Experiences + Reflections ➞ Principles }
applications for education: A classroom teacher can help students learn Principles for Problem Solving in both ways — from their discoveries (recognitions) and from explanations — during classroom activities that have been designed to guide students in a process of Experience + Reflection ➞ Principles that uses a process-of-inquiry to help them understand principles-for-inquiry, i.e. to understand principles for problem solving.
Because of this focus on their own actions, Discovery Learning (that actually is Recognition Learning) can work much better for learning procedural knowledge (i.e. Problem-Solving Process) than it does for learning declarative knowledge (aka factual knowledge); e.g. I know chemistry well, and almost everything I know is due to Learning from Explanations – by hearing and (especially) reading others – not Learning by Discovery.
[[ also -- link to ws#cmei or home#cmei -- and to #is0 early? ]]
EDU -- Your studying may stimulate you to think about the process of “doing Evaluations while you are Solving Problems” in new ways, or maybe it will show what you already have been thinking. / two ways to learn: I think you'll enjoy your discoveries, and also my explanations.
iou – during March 13-15, I will begin writing sections about Essential Actions — Learn, Define Goal & Define Goal-Criteria, Choose an Option (to be your Problem-Solution) and Actualize this Option — in the two text-boxes (at Top & Bottom) of Diagrams 1 and 3.
using Science-Design
iou – later, I'll modify this section by adding sub-sections, and revising what is below.
Here are three contexts for using Science-Design:
• during General Design: You use a functional Reality Check (in a functional check of a Theory that's being used to make Predictions) when you are "surprised" because Predictions are not matched by Observations, during a Project for General Design.
• in Everyday Science: in a Project for Science-Design, when during everyday life a Theory is being Evaluated by a non-expert. Or in a classroom, when a teacher designs POE Activities so students can Predict-Observe-Explain and Learn.
• in Research Science: in a Project for Science-Design, when a Theory is being Evaluated by experts. They... can work in academia or business; publish in research journals (for science or medicine); do Experiments and apply for research grants,...
checking a Reality Check: In any context, instead of responding to a failed Reality Check (with Predictions ≠ Observations) by simply concluding “the theory is wrong” you can examine each thing that's involved in the Reality Check, because the lack of close matching could be due to errors in... • the Predictions (in the Inductive Logic or Deductive Logic); • the Observations (in Designing the Experiment, Doing the Experiment, or Making Observations); • the logic of comparing Predictions with Observations; • the Main Theory (used to make Predictions) or Supplementary Theories (that also are used). All of these possibilities can be considered when you ask “why was the matching not closer?”
ws.htm#trlife --- Students use scientific reasoning often in life, whenever they hear a claim and ask “what is the evidence-and-logic supporting this claim?” In all areas of life, they can use Science to improve their Theories about “how the world works” and improve the accuracy of their Predictions about “what will happen.” And they can develop a logically appropriate humility – with justifiable confidence that is not too little, and not too much – when estimating the plausibility status of claims for truth claims for truth that are made by themselves and by others. In these three ways, their better understandings will help them make wise decisions while pursuing their goals in life. [[claims - hear or make]]
website.htm#trlife --- Transfer of Science-Skills into Life: In all of life (not just in science) we use our personal theories about “how the world works” to understand “what is happening” and to imagine “what will happen” when we make predictions that, along with our values & priorities, can help us make wise decisions, personally and professionally, to help us achieve our goals in life. In all areas of life we use the logic of science (to evaluate, infer, persuade) whenever someone makes a claim and we ask “what is the evidence-and-logic supporting this claim?” Teachers can use this wide scope by combining Scientific Logic with generalized Critical Thinking in activities that include lively debates and analysis of Logical Fallacies. This is one way to motivate a wider range of students so they will want to improve their skills with the Design Thinking they use for all kinds of STEM/STEAM Education and beyond, because critical evaluation of ideas is essential for skillful reading/writing & listening/speaking, and thus for many of the worthy educational goals in Common Core and Next Generation Science Standards.
Appropriate Humility, to Avoid Two Errors: Improved scientific reasoning will promote the logically appropriate humility (with a confidence that is not too little, not too much) described by Bertrand Russell: "Error is not only the absolute error of believing what is false, but also the quantitative error of believing more or less strongly than is warranted by the degree of credibility properly attaching to the proposition believed, in relation to the believer's knowledge." An appropriate humility will help us avoid 2 of these 3 kinds of error. {Accurate Understanding - thus appropriate humility? - and Respectful Attitudes} {The Rationality-and-Idiocy of Postmodernism} {a revised-and-condensed version of Education to Prepare for Life with Transfer of Skills into Life when students improve their skills of creative-and-critical productive thinking that can be improved by using a wide variety of Strategies for Thinking taught using Strategies for Teaching}
|
iou – March 17-21, I'll condense-and-revise the sections below, which explain how we make Predictions and make Observations, how we use Old-and-New) during Design Process. These sections are in a "dark brown box" to show that they need to be revised.
Levels of Design Process
what an Actions Diagram IS and ISN'T: In my model for Design Process, an Actions Diagram shows the multiple Actions that can occur at different times – not simultaneously – during a process of problem solving. Therefore a diagram IS NOT a snapshot photo of what is happening at any specific time. Instead each multi-action diagram IS like a photo that shows the superimposing of all Actions that have occurred in a time-lapse video of “the Action being done now” (at many different now-times) during an entire process of problem solving, so all of the separate Actions are visible in a single photo.
what an Actions Diagram IS and ISN'T : When we ask “is there a Method?” for Scientific Method {or “is there a Process?” for Design Process}, why is the best answer No and Yes? It's NO because there is not a rigid long-term sequence of steps for a Method {or Process} that is used in the same way by all people, in all areas, at all times. But it's YES because – with a less restrictive definition of method {or process} – people do tend to be more effective when we use strategic goal-directed Actions, and these Actions are shown in the Action Diagrams for Design Process. Although it's YES you use a flexible process that is analogous to the goal-directed improvising of a hockey player, but not the rigid choreography of a figure skater. Therefore an Actions Diagram ISN'T a single fixed sequence – although you often use common Action Sequences – but it IS like a roadmap showing many branch-points where you can decide “what to do next” to coordinate your Process of Problem Solving. { Design Process includes Science Process }
Design Process is a family of models: The process of solving problems can be described in many different ways. One option is to use the many sub-models within my model for Design Process.* Each sub-model has an Actions-Diagram that is accurate in different ways — because each model selects different Actions to include & exclude — and is educationally useful in different ways. All models are similar because each describes the same overall Design Process; but each is different (so they are semi-similar) because each model includes – and thus encourages a student to think about – different aspects of the overall process. / * Another option is to use the usefully-detailed descriptions in 10 Modes of Action.
using multiple models for instruction: Having a variety of sub-models gives teachers flexibility in designing their instruction, so they can use a progression – beginning with simplicity and gradually building complexity – to help students understand the sub-models and the overall model. And it's practical for students, encouraging them to “think in different ways” for different problems, because their problem-solving process varies from one life-situation to another. / When using Design Process the three main sub-models are all that's necssary, but SRL-with-DP also is valuable because metacognitive Thinking Strategies are valuable. / I've developed many other models, e.g. these 19 that include a Clicker Map. d in a research report° – gen
using a simpler model: You can see a progression from simplicity to complexity when Diagrams 1 & 2 are combined to form Diagram 3, with “1+2 = 3”. Or a teacher can begin with a model that is simpler: first you choose an Objective (for what you want to improve) and understand “what is” in the NOW-State, and imagine “what it could be” in a future GOAL-State, and how this would be better; then you do “problem solving” to convert The Now-State into a Desired Goal-State. /  I found this Old Model – it's “public domain” (it isn't part of the model I've constructed for Design Process) – by searching our collective memory. Its simplicity gives it practical cognitive utility and educational value. { although this model is simple, it has been developed in sophisticated ways in cognitive science, ====. { terms: a Now-State & Goal-State also can be called Current Situation & Future Situation; and other terms are possible. } I found this Old Model – it's “public domain” (it isn't part of the model I've constructed for Design Process) – by searching our collective memory. Its simplicity gives it practical cognitive utility and educational value. { although this model is simple, it has been developed in sophisticated ways in cognitive science, ====. { terms: a Now-State & Goal-State also can be called Current Situation & Future Situation; and other terms are possible. }
my overall model for Design Process is a family of individual models (e.g. with Diagrams 1,2,3, plus the “isolation diagram” and DP-for-SRL diagram. why? I'll describe the benefits-for-instruction of having “a family of models” in Design Process; e.g. in another page you can see 19 diagrams (the 5 in this page plus 14 others), including a Clicker Map but I think the only one that will be commonly used in classrooms is the SRL-for-DP that is designed for teaching SRL-with-DP.
[ iou – This section will be written February 18-20, to describe how we can use different levels of my model.
[ My model for Design Process is a Family of Models, e.g. Diagram 1 by itself (for awhile), Diagram 1+2 (or Diagram 2) by itself for awhile
[ return to parts -- e.g. using D-1 with just Cycles of G-and-E for Metacognitive Checklist, then use D-2 as needed
[ or supplement Top-of-D1 with Now-to-Goal, to emphasize Understanding and Define Goal and Define Goal-Criteria, arrow for PS is GE-Cycles
[ tips: (old-and-new firsthand-and-secondhand) (dpmo-2D-2E, making Predictions & Observations) (check dpha for other bonus-tips)
Design Process describes "the basic process" — the essential Problem-Solving Actions that we always do — but not the complete process. These basic actions are necessary for problem solving, but are not always sufficient for optimally-effective problem solving. Therefore, sometimes it can be useful to supplement the principles & strategies of Design Process with the principles & strategies of other Models-for-Process, as explained in Combining My Model with Other Models or with Different Levels of Design Process.
|
|
4 Levels of Problem-Solving Activities:
During their school activities a student can have Experiences (of Doing Inquiry with Design-Inquiry and/or Science-Inquiry when they are solving problems), and do Reflections (on their Experiences), and learn Principles (for Doing Inquiry) like those in my models-for-process, with a possible result of Experiences + Reflections ➞ Principles. / Of course, students can get valuable experiences in all three ways, when they do an activity (Experiences) and reflect on it (Reflections) and learn from it (Principles). {what is inquiry?}
For each aspect of problem-solving Inquiry, a classroom teacher can decide Yes or No, choosing whether to add Experience and Reflection and Principles. Their choices about ERP lead to 4 levels of Problem-Solving Activities, by giving students no Experiences; or only Experiences; or Experiences + Reflections; or (as I think is best) Experiences + Reflections + Principles. {* of course, students can get “E's and R's and P's” on their own, so this table shows only teacher-planned E's and R's "in a classroom", and explicitly-taught P's.}
| 0 |
no Experiences (in a classroom)* |
1 |
Experiences |
|
2 |
Experiences |
+Reflections |
3 |
Experiences |
+Reflections+Principles |
Above I describe some questions you can ask — about ERP-Activities {do you want none, or only-E, or E+R, or E+R➞P?} and Principles {is Experience-plus-Principles better than only-Experience? and is it useful to organize Principles-for-process into a Model-for-process?} — and here are my responses:
If students use my Model of Design Process (in a system of Experience + Reflection ➞ Principles), will this help them develop a better understanding of problem-solving process? Certainly. But... will this improved understanding-of-process help students improve their doing-of-process? Probably.
What – Goal-Directed Designing of Curriculum & Instruction: To use this strategy, we...
DEFINE GOALS for desired outcomes of our CURRICULUM, for ideas-and-skills we want students to learn,
DESIGN INSTRUCTION with learning activities (and associated teaching activities) that will provide opportunities for experience with these ideas & skills, and will help students learn more from their experiences. The activities can have a goal-directed purpose that is narrow — as with Aesop's Activities that (analogous to Aesop's Fables) are designed to teach a specific idea or skill — or is broad, to teach general skills that are useful in many areas of life.
What – Designing a Coordinated Wide-Spiral Curriculum: The wide scope of problem solving (it includes almost everything students do) lets teachers use problem-solving activities in all subject areas — in sciences, engineering, business, humanities, and arts, in STEAM and beyond, in an ideas-and-skills curriculum with wide scope — so in every area students can have analogous experiences with problem-solving Design Thinking, using a process of General Design and/or Science-Design that adapts to match their problem-solving Objectives. These experiences can be part of a wide spiral curriculum that has wide scope (so related learning experiences are coordinated across different areas) and uses spiral repetitions (so learning experiences are coordinated over time), for helping all students (of all ages) improve their problem-solving skills and their basic skills & knowledge. {more: Goal-Directed Designing of a Wide-Spiral Curriculum – What, Why, Who, How – using instruction spirals that are short-term narrow, short-term wide, long-term wide.}
How – by using Broad Definitions and a Simple Model: We can build bridges...
• by creatively using broad definitions for problem (it's "any opportunity to make things better, in any area of life") and problem solving (it's "whenever you try to make things better") so we can show students that "their problem-solving activities include almost everything they do in life," both inside school and outside school, and
• by logically using my models for Design Process — when students Define a Problem, then try to Solve this Problem with creative-and-critical thinking, by creatively Generating Ideas and (with basic logic) critically Evaluating Ideas — teachers can show students how they use the same basic process to solve problems (to "make things better") in "almost everything they do," in school-life and everyday life, so we can build connecting bridges between school and life.
How can a teacher "show" students the connections between the problem solving they do in school and in life? One useful teaching strategy is to use...
Discovery Learning for Process, with
Experience + Reflection ➞ Principles: How can teachers help students recognize the problem-solving process they do in everyday life, and are doing in school? With a series of ERP Discovery-Activities, by using a process of inquiry — with Experience (when students are solving problems, in an activity of Design-Inquiry or Science-Inquiry)* plus Reflections (on their Experience) that help them recognize Principles (for their problem-solving process) — to teach principles for inquiry, to help students improve their process of problem solving. This overall process-of-metacognition can be summarized as Experiences + Reflections ➞ Principles, abbreviated ERP. {more about ERP and learning by discovery with ERP}
repeated Experiences-and-Reflections: In a coordinated Wide-Spiral Curriculum that uses Design Process in spiral repetitions (so students have problem-solving experiences in all grades), what a student learns in 1st Grade will affect their “discovery learning” in 2nd Grade,* so instruction with ERP will have to be adjusted, especially for Reflections. { A teacher would need to adjust in many ways, e.g. because some students already have used ERP + Design Process (in 1st Grade) but some have not (because in 1st Grade their teacher didn't use it, or if they moved into your school from a school that doesn't use Design Process). }
teaching ERP with guided discovery: With an unguided process of “pure discovery” students would discover some Principles of Design Process (but probably not all Principles), and almost certainly they wouldn't discover the logically-organized Framework that you see in Diagram 3. But if a divergent “pure discovery” (without guiding) is converted into convergent “goal-directed discovery” (with wise guiding by a teacher), students will get most of the satisfaction of self-discovering, AND they will get benefits from learning the Principles-and-Framework of Design Process. { Or a teacher might want to modify the Framework, and modify-or-add Principles, and of course that's fine with me; and if these changes are stimulated by student discoveries during ERP, this would be empowering for students. } / But even if a teacher uses the Framework (as-is) along with basic Principles, there will be plenty of additional Principles for students to discover with continuing metacognitive ERP, plus many ways for them to apply Principles during their wide variety of Problem-Solving Experiences.
Experience before Principles: In ERP, notice that E comes before P. This sequencing is important, so it's emphasized in prominent theories of learning. And it's supported by abundant evidence in educational research. Doing E-before-P is one reason that when students are first beginning to do Inquiry Activities (with Design-Inquiry or Science-Inquiry) a teacher can choose to use either of two models – either the simplest model of Design Process or another model – to provide a structure for their “do, think, and learn” inquiry.
* What is inquiry? Opportunities for inquiry occur whenever a gap in knowledge — in conceptual knowledge (so students don't understand) or procedural knowledge (so they don't know what to do, or how) — stimulates action (mental and/or physical) and students are allowed to do-think-learn. Of course, activities to do-think-learn go beyond inquiry — because students can do-think-learn when they listen and talk, read and write, question and answer, explore and observe, investigate, analyze, and solve — but include inquiry activities with Design-Inquiry & Science-Inquiry, with Design Thinking. Due to the wide scope of design, students are using the problem-solving process of Design Thinking for almost everything they do in everyday life and in school, so...
Discovering is Recognizing: When students are using ERP Activities to observe (and learn from) their own problem-solving actions, instead of discovering they are recognizing. Because of this focus on their own actions, Discovery Learning – that actually is Recognition Learning – can work much better for learning-about-process than it does for a learning-of-concepts. / This familiarity is why earlier I said that in Part 2 you'll see my "innovative [new] ideas about how we can verbally-and-visually describe familiar [old] actions." Soon you'll have an opportunity to do your own Discovery Learning, to recognize - and thus discover - useful insights about problem-solving process.
[ guiding – ask questions to stimulate recognition of "variety within a particular problem-type" plus "variety between problem-types" (intra and inter?)
How? When you begin with Recognition Learning, your Discovery Learning will occur in two stages:
A) First think about how you intuitively have solved problems in the past, to convert your implicit knowledge (of Your Process) into explicit knowledge (about Your Process). While you're doing these memory-based Reflections, your Discovery Learning (for Your Process) can be guided with Self-Questions. Begin your Guided Discovery by asking "what kinds of Problems have I solved?" You will Recognize a wider variety of Problem-Solving Experiences if you broadly define a Problem as an opportunity to make something better (in any area of life) – so Problem Solving occurs whenever you do make something better. For each kind of Problem, reflect on your many Experiences and ask "what were the Essential Actions that typically have been useful for my Problem-Solving Process (to make progress) and for the Problem-Solution (to increase its Quality)?" and "what Actions have I used to Evaluate competitive Solution-Options?"
B) After awhile, shift your focus; use Discovery Learning (for Design Process) to understand my model, and use Recognition Learning to realize that Design Process is Your Process. How? During your adventure of active learning, you will “learn by doing” with stop-and-go reading* so my questions can guide your explorations when you study the diagram of Problem-Solving Process. / * IOW – You won't be able to speed-read but I think your ratio of “ideas learned / time invested” will be high, and you'll enjoy the process, and the results will be satisfying.
Inquiry using Design Activities (put into right frame`)
Designing for Learning: In a goal-directed designing of instruction we define goals for ideas & skills, and then "design instruction with learning activities (and associated teaching activities) that will provide opportunities for experience with these ideas & skills, and help students learn more from their experiences."
Choices by Teachers and Students: The wide scope of problem-solving Design Thinking makes it easy to find life-relevant design activities that are fun now and will be useful later so students will be more motivated to think, do, and learn. The choice of a design objective can be made by teachers who carefully develop goal-directed Aesop's Activities,* and by students (usually with some guidance) because they will be “doing design” for any objective they choose, although with some choices they can learn more than with others. {* One source of educational goals for ideas-and-skills is the system of coordinated guidelines, for both ideas and skills, in the new Common Core & Science Standards. }
A Wide Variety of Options: Students use a process of Problem-Solving Design for almost everything they do in life and in school, so teachers of any subject, for students of any age, have a wide range of options for Design Activities (i.e., Design Experiences) that are Doing-Thinking-Learning Activities for improving their ideas-and-skills. During a do-think-learn activity, students can listen and talk, read and write, question and answer, explore and observe, investigate, analyze, and solve. {how can teachers find old (or new) activities?}
Four types of DESIGN ACTIVITIES (•• • •) are Inquiring & Inquiring with Arguing, and Strategizing:
•• Two Kinds of Inquiry Activity
Students can do science-inquiry and design-inquiry. What is inquiry? Opportunities for inquiry occur whenever a gap in knowledge — in conceptual knowledge (so students don't understand) or procedural knowledge (so they don't know what to do, or how) — stimulates action (mental and/or physical) and students are allowed to think-do-learn.
In two kinds of design people try to "make things better" by solving a problem. We want to...
improve our understanding in Science-Design (i.e., in Science), by asking questions and seeking answers.
improve some other aspect(s) of life in General Design (i.e. in Design), by defining problems and seeking solutions.
With two kinds of Design Activities,...
in Science-Inquiry students ask-and-answer questions with Science-Design, to design a useful experiment or a better theory.
in Design-Inquiry they define-and-solve problems with General Design, which includes Engineering, to design a better product, activity, strategy, or relationship.
Due to overlaps — when with crossover actions an engineer sometimes does science, and a scientist sometimes does engineering — students often will combine both types of inquiry in a Learning Experience, which thus becomes Design-and-Science Inquiry. By using these overlaps we can build transfer-bridges from design-inquiry to science-inquiry, and vice versa. {building 3 kinds of Educational Bridges}
• Argumentation Activities: [[ iou – Soon, probably in mid-2025, this section will be revised. ]] Inquiry activities (for both General Design and Science-Design) can include argumentation activities — to let students generate-and-evaluate arguments by using evaluation (based on evidence & logic), strategies, and communication — to improve argumentation skills. These argument activities can span a wide range of topics,* and may be more educationally effective when teachers use an instructional framework of CER (Claim + Evidence + Reasoning) supplemented by principles of Design Process.
• Strategizing Activities to develop-and-use
Strategies for Thinking (and for Learning)
In a special kind of Design-Inquiry, students develop-and-apply cognitive/metacognitive thinking strategies (of many kinds) by learning from experience using a process of design; and to develop-and-apply learning strategies. The goal of a Strategy for Thinking is to improve the quality of performing and/or learning for their own ideas-and-skills with proactive personal education. The goal of a Strategy for Learning is to improve the quality for their learning of conceptual knowledge and/or procedural knowledge, and their transferring (to different areas, and through time) of conceptual & procedural knowledge.
In a special kind of thinking strategy, students use a process-of-inquiry to discover principles-of-inquiry during their experiences-with-inquiry. Why should we expect experience plus principles to be useful? |
combining different
Models-for-Process
I'm not thinking “my model versus other models” because we don't have to make either-or choices between models. Instead we can invent creative strategies to effectively combine models, so it's “my model plus other models.” We can design instruction to include different models so our models will interact in ways that are synergistically supportive — that make the combination of models better than any single model by itself — because Design Process (DP)...
• is similar to other models — with basic agreement about the productive thinking & actions we use during a creative-and-critical process of problem solving — so DP is educationally compatible with other models and it “plays well” with them. DP can be smoothly blended into most systems of instruction, using common methods for teaching inquiry, whether the instruction currently does or doesn't use another model. This offers practical benefits, because we don't have to design DP-specific activities, instead we can just add DP to already-available activities that have been using other models, or using no models.
• is distinctive in important ways; DP has special features that produce added value so DP can be especially valuable in a well-designed combination of models, contributing to a synergism that provides added benefits for students.
Together it's “yes and” with “yes” due to similarities for educational compatibility, with “and” due to distinctive added value.
Structures and Strategies: The main reason that we can "effectively combine models" is because each model-for-process is educationally useful in two ways, by providing structures (for instruction) and strategies (for thinking). Each model has its own structures & strategies, so each offers its own benefits for students. If our instruction is designed effectively, when we combine the structures & strategies from two (or more) models, we combine their benefits.
iou – during late-October, I'll write an introduction to briefly describe the benefits of combining general metacognitive strategies (e.g. SRL) with specific metacognitive strategies (using the framework of Design Process), and principles for doing this effectively. And also for combining POE (to introduce the Science Process that's used in Science-Design) with DP (to integrate Science-Design with General Design).
[[ I recommend SRL and POE with any program -- and if you're already using another model-for-process, it will be compatible with DP ]]
Design Process and POE (Predict, Observe, Explain)
I think SRL-with-DP is more important, but describing POE-within-DP is easier so I'll do this first. / iou – during July 22-onward, I'll write this paragraph.---- activities designed for POE give many opportunities for The Design Question (am I surprised?) because one purpose is to grab attention by "shaking up" and to revise misconceptions -- Reality Checks are Empirical Factor, is usually main factor, but also Cultural-Personal and --- in ISM during PhD
Design Process and SRL (Self-Regulated Learning)
iou – This important section is basically OK now, but it "needs fixing" in some ways, so I'll revise it during July 7-9.
Why? When we show students how to use SRL-with-DP, this is helpful because... • DP is an easy way to deeply understand the process of using SRL Cycles; • scientific research has shown that using SRL is an effective method for helping students develop-and-use metacognition that improves their academic skills and social-emotional skills; • we can view SRL-with-DP as "SRL Plus" because DP offers "added value" that includes improving two kinds of transfer (Across Areas and Through Time) due to the two wide scopes of DP (for Activities & Process), and
 Design Process and SRL Cycles: This diagram-for-DP accurately shows the process used in a Cycle of SRL, with important details about the two stages of SRL when you mentally PLAN, then physically-and-mentally DO-and-Monitor. First, to "mentally PLAN" you "use [multiple] Mental Experiments to Generate-and-Evaluate Options [these are quick-and-easy compared with Physical Experiments, because you just “imagine what will happen” to make PREDICTIONS] and Choose an Option to USE." Second, to "physically DO and mentally MONITOR" you "USE this Option in [one] Physical Experiment [to physically DO] and [to mentally MONITOR, you] OBSERVE the Situation, your Actions, the Results." You complete the SRL Cycle by connecting the two stages (first PLAN, then DO-and-MONITOR), you "EVALUATE, asking ‘revise Option?’ in Design Cycle during re-PLAN." / the color-coding shows a common way to define the stages of SRL as PLAN-MONITOR-EVALUATE, that sometimes is aka PLAN-DO-EVALUATE. / iou – I also will briefly describe SELf-Questioning methods, like those in The Metacognitive Student (by Cohen, et al) that is related to SRL but may offer strategies that appeal to some teachers, and I'll link to places where their methods (and principles) are explained with more detail. Design Process and SRL Cycles: This diagram-for-DP accurately shows the process used in a Cycle of SRL, with important details about the two stages of SRL when you mentally PLAN, then physically-and-mentally DO-and-Monitor. First, to "mentally PLAN" you "use [multiple] Mental Experiments to Generate-and-Evaluate Options [these are quick-and-easy compared with Physical Experiments, because you just “imagine what will happen” to make PREDICTIONS] and Choose an Option to USE." Second, to "physically DO and mentally MONITOR" you "USE this Option in [one] Physical Experiment [to physically DO] and [to mentally MONITOR, you] OBSERVE the Situation, your Actions, the Results." You complete the SRL Cycle by connecting the two stages (first PLAN, then DO-and-MONITOR), you "EVALUATE, asking ‘revise Option?’ in Design Cycle during re-PLAN." / the color-coding shows a common way to define the stages of SRL as PLAN-MONITOR-EVALUATE, that sometimes is aka PLAN-DO-EVALUATE. / iou – I also will briefly describe SELf-Questioning methods, like those in The Metacognitive Student (by Cohen, et al) that is related to SRL but may offer strategies that appeal to some teachers, and I'll link to places where their methods (and principles) are explained with more detail.
iou – I also will write a brief paragraph about relationships between Design Thinking (as in d.school of Stanford) to explain why they're compatible, and Design Process is a good way to learn-and-use Design Thinking; and I'll link to "details" in my big page about DP and Other Models.
We can combine Design Process with other models-for-process because there is “yes and” with “yes” due to similarities, with “and” for distinctive added value. Here are three distinctive “added value” features of Design Process (DP). { You can quickly learn DP – and these features – with your discoveries plus my explanations. }
DP logically integrates Design and Science, because the core of its evaluation-logic (when 3 Elements are used in 3 Comparisons) leads naturally to it being used for both General Design (aka Design, the usual term) and Science-Design (aka Science, usually). By contrast, most other models are for a process of either Design or Science, but not both. When students understand the smooth integrating of design-with-science in my model this will help them develop a smooth integrating of design-with-science in their thinking while they're solving problems. {more about the differences when we're comparing my model for Design-AND-Science with other models that are Design-OR-Science}
DP is a family of models: One reason for the educational utility of DP is because it's a Model (capitalized) that is a logically organized family of models. This logical “family structure” lets a teacher use different models in a 4-Stage progression of learning so students can begin with simplicity and gradually learn the complexities in an intuitive progression. The progression is intuitive and it works well, because each model is a different version of the same Model. Each model is "a different version" of the Model, with a different description of the same process; each model features different aspects of the Model. { Due to these differences, each model accurately describes in different ways, and each model is educationally useful in different ways. } / When principles for process (it's procedural knowledge) are verbally-and-visually organized – as in my Model for Design Process – this produces many kinds of educational benefits.
DP is modular: Another distinctive of Design Process (DP) is how its modularity encourages a flexibly customized coordinating of problem-solving process.* DP describes our problem-solving process with short-term Actions (that can be functionally connected to form short-term Sequences) but other models typically describe longer-term Phases that contain the shorter-term Actions & Sequences of DP; using DP can help students understand how their creative-and-critical productive thinking happens during the short-term Actions & Sequences of DP. And because our Models (my DP and another Model) operate at different “levels” (with short-term in DP, long-term in other Models) it's less likely that our Models will compete with each other to perform the same teaching-functions during instruction. Instead we can use the different Models for different functions, so they will be supportive instead of competitive, with each contributing to the instruction. For thinking about DP's modularity, a useful analogy is using LEGO Bricks (the short-term Actions & Sequences of DP) to make LEGO Objects (the longer-term Phases of other Models), or using small atoms & molecules (the Actions & Sequences of DP) to form larger objects (the Phases of other Models). {* Wikipedia says "modularity is the degree to which a system's components may be separated and recombined, often with the benefit [thus produced] of flexibility and variety in use." }
The full-length section ends by describing possibilities for combining DP with other Models, especially with POE (Predict-Observe-Explain) and CER (Claim-Evidence-Reasoning) but also with others. And these ideas are examined with more depth in another page. |
|
This section describes (and links to) places in the Detailed Overview where each Action in Design Process is described at a deeper level, with many useful details that will be useful for helping students learn, for improving valuable problem-solving skills.
This diagram shows connections between the diagrams for Design Process and the 10 Modes of Action in Design Process. Below it are links to descriptions (in the Details Page) for each of the 10 Modes of Action, to explain WHAT is being done and HOW to do it better. The 10 Main Actions are functionally organized to form the diagrams in my model for Design Process. The 10 Modes are a different perspective; they're an educationally-useful way to develop a deeper understanding for the individual Actions in my family of models for problem-solving Design Process.
Here are 10 Modes of Action – organized into 4 categories with colorizing – that people use during their Design Process, during their Problem-Solving Process:
1. DEFINITION (at top of Diagram 1`):
1A. Define an Objective (what you want to design) for a Design Project,
1B. Define Goals (for the desired properties of a problem-Solution),
2. GENERATION (to get information, both old & new) (in Diagrams 1, 2a, 3b, 4a/4b)
2A. Learn (find old information about Options & Predictions/Observations, Models),
2B. Generate Options (by modifying old Options, or innovating with new kinds of Options),
2-CDE. Experiments (to MAKE Information that we USE) play key roles in Design Process:
2C. Design Experiments (for Mental Experimenting, Physical Experimenting, or both),
2D. Predict (imagine in a Mental Experiment, to MAKE Predictions for USE in 3A & 3B),
2E. Observe (actualize in Physical Experiment, MAKE Observations to USE in 3A & 3B),
3. EVALUATION (in Design Cycles and Science Cycle of Diagram 3b):
3A. Evaluate Solution-Options by using Quality Checks
3A. (by COMPARING Goals with Predictions or Observations),
3B. Evaluate Model-Options by using Reality Checks
3B. (by COMPARING Predictions with Observations),
4. COORDINATION (often including Communication & Collaboration)
4A. Evaluate the Process and Make Action-Decisions (for what to do and when)
4A. as an individual or (in a group project) using Communication for Collaboration.
These 10 modes are not 10 steps, because Design Process is not a rigid sequence of steps. Instead we see interactions between thinking in different modes, in productive thinking that skillfully blends a knowledge of ideas with creativity and critical thinking.
For each mode, the section below describes WHAT is being done and HOW to do it better. |
Copyright © 1978-2026 by Craig Rusbult. All Rights Reserved.